Reading Europe through its data
A continent measured in decimals: prices, work, movement, energy, age. Studies across 25 statistical domains, written to make the evidence readable rather than impressive.
How every study is built
Browse the categories
Recently published studies
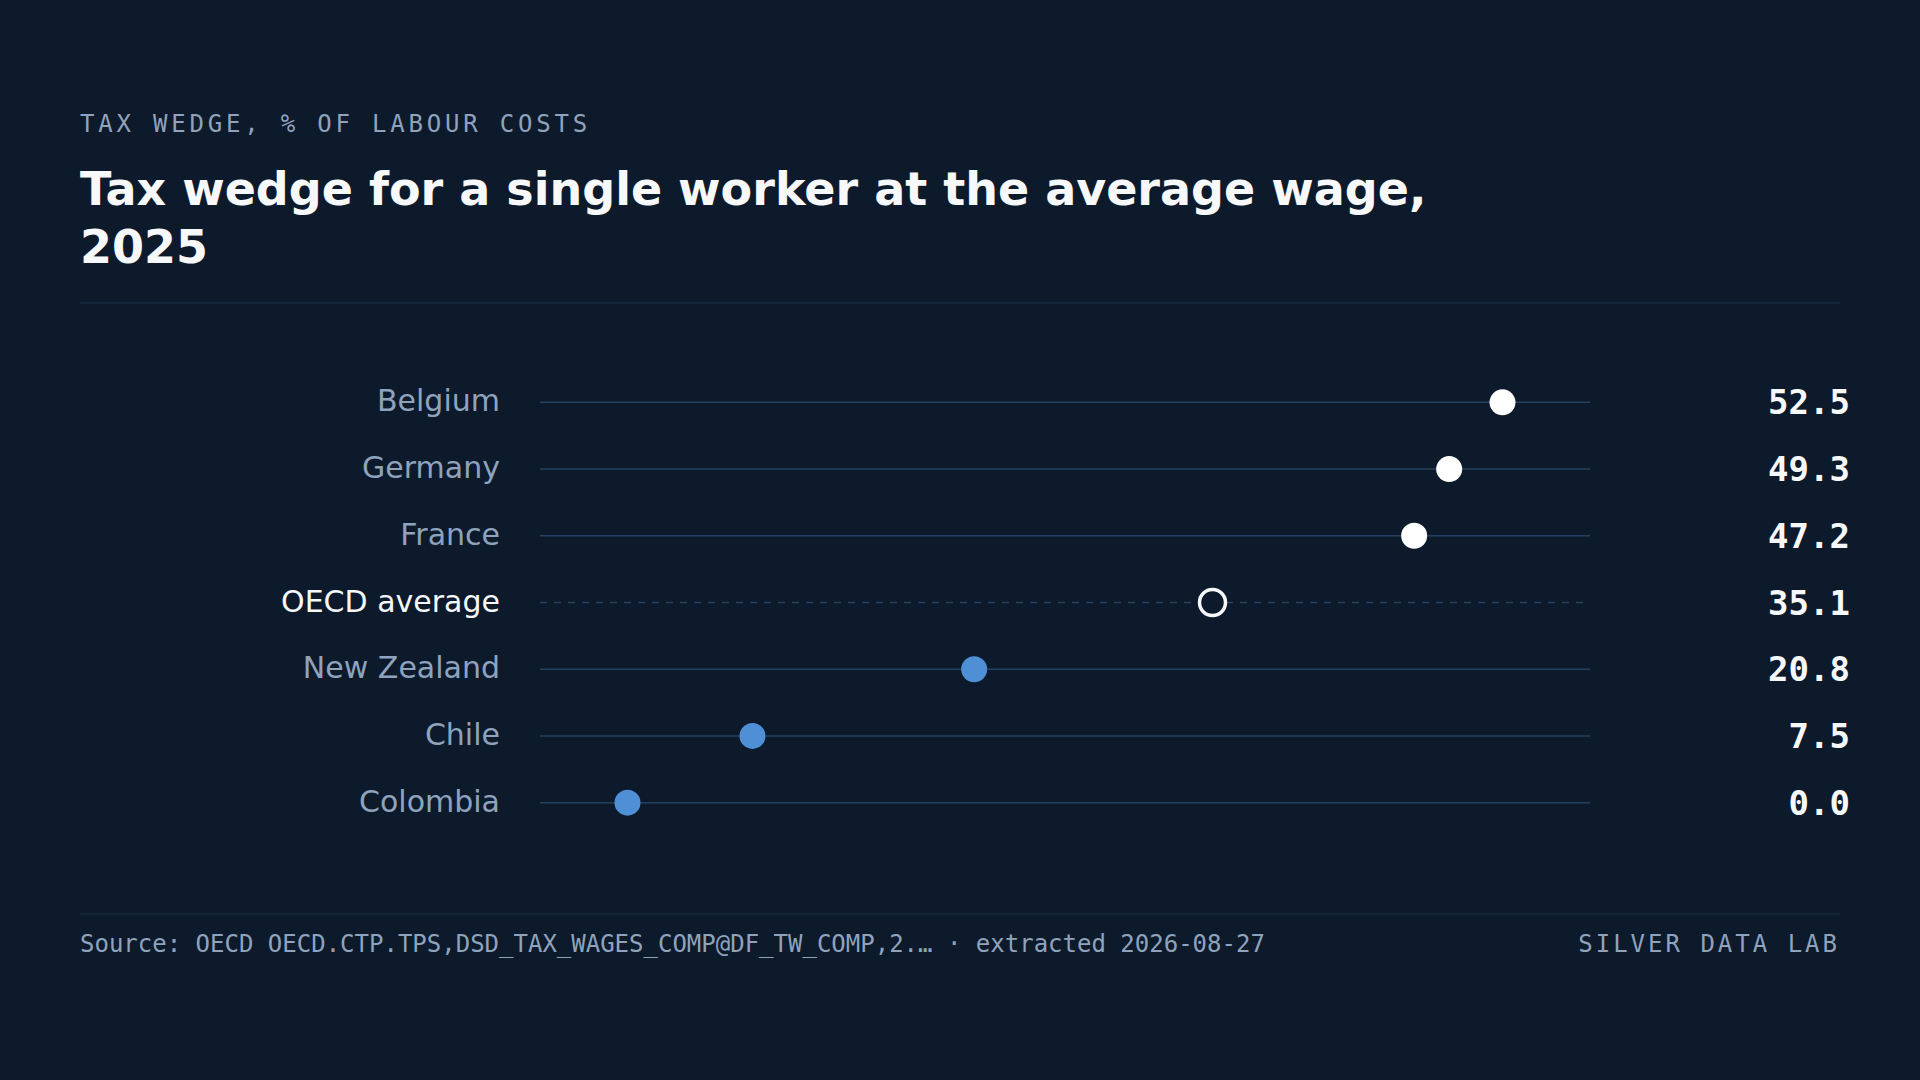
The Thirteen OECD Countries That Tax Labour Most Are All in the EU
The tax wedge — the share of total labour costs taken by income tax and social contributions — was 41.7% for a single average-wage worker across the 22 EU members of the OECD in 2025, against an OECD average of 35.1%.
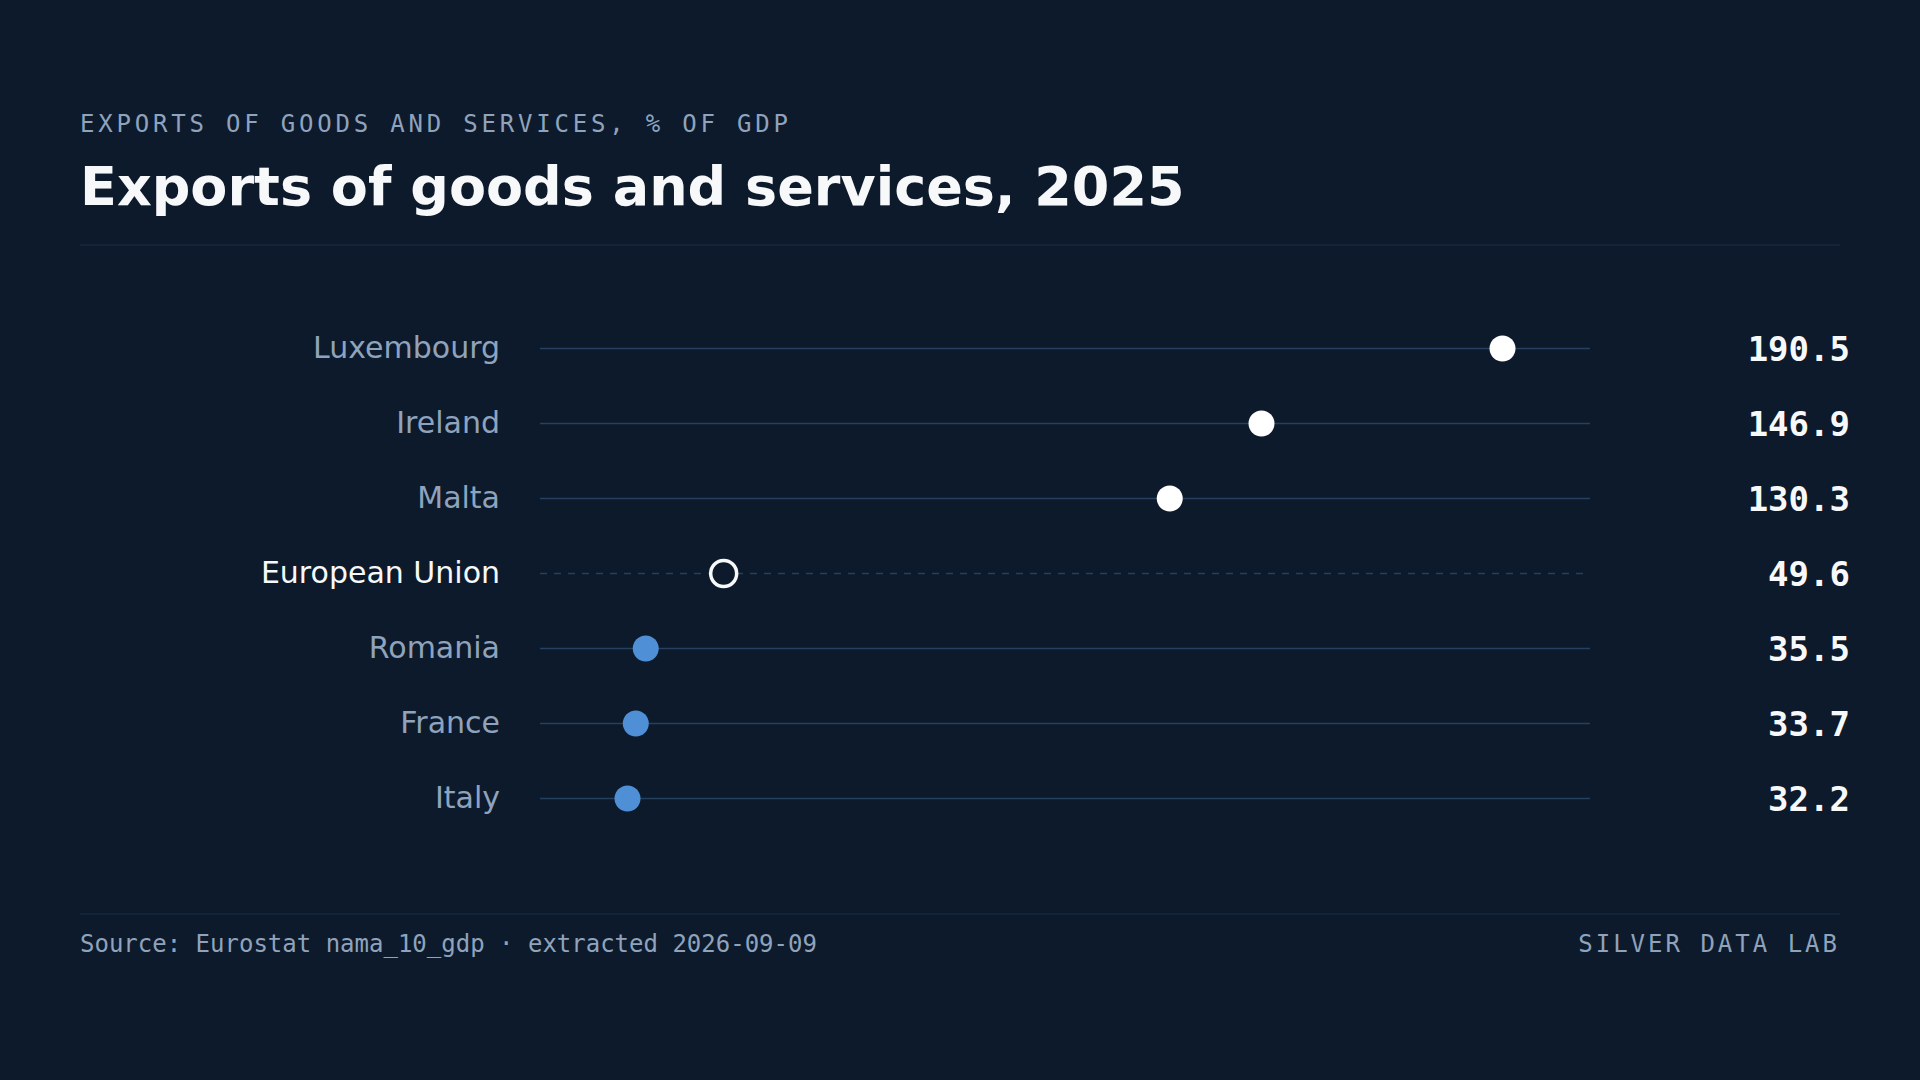
The EU's Four Largest Economies Are Among Its Least Open
Exports of goods and services from the 27 Member States equalled 49.6% of their combined GDP in 2025.
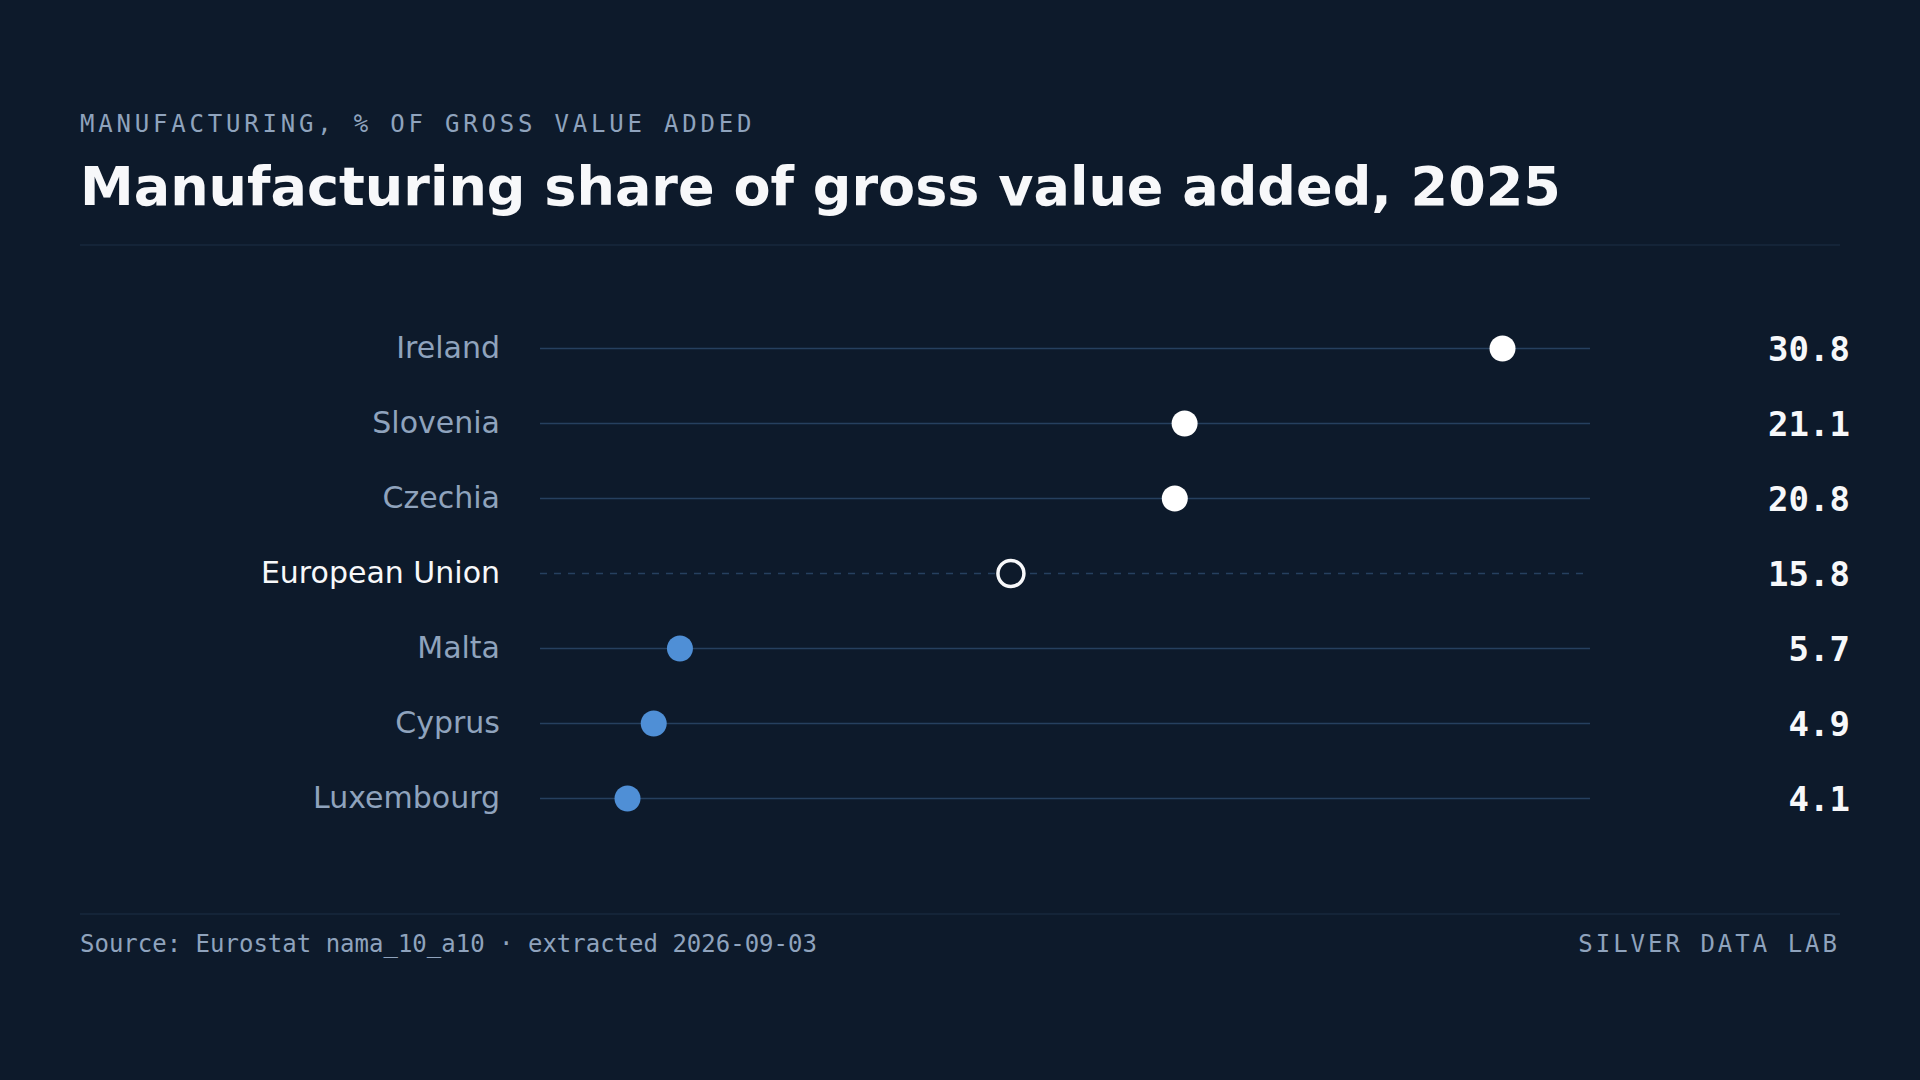
France Manufactures a Smaller Share of Its Economy Than Bulgaria
Manufacturing accounted for 15.8% of gross value added in the EU in 2025.
Source and extraction
Each study begins at a named dataset published by an official European statistical body. The filters are chosen deliberately, recorded on the page, and the extracted file is archived so the same query can be run again.
Recomputation
Every figure is computed from the archived extraction rather than carried over from an earlier draft. Values the source does not publish itself are recomputed and marked as derived where they appear.
Publication with its limits
Series breaks, coverage gaps and definitional differences are set out in the study, and the link to the source catalogue stays on the page so any figure can be followed back to the table it came from.